


 Bogdan Cretu
 After starting your first advertising campaign with Coinzilla, it’s essential to focus on campaign tracking to measure performance. This article covers the basic metrics and tools you need to track your campaigns effectively.
Table of Contents
1. What Metrics Are Important?
There are two main metrics around which all the others revolve: clicks and impressions.
Clicks measure how many times a user clicks on your ad.
As for impressions, represent how many times users have viewed your ads on the websites where they are displayed.
Next is the CTR (Click-Through Rate), which is obtained by dividing your clicks by your total impressions. This is the percentage of people who clicked on your ads from the total number of people who saw them.
For example, if you had 10 clicks and 400 impressions, the calculation would be 10 ÷ 400 = 0.025, which equals a 2.5% CTR.
Other standard metrics are:
- Cost: The total amount you’ve spent so far on your campaign.
- CPC (Cost Per Click): This tells you how much you pay for each click. To find it, divide your total cost by the number of clicks.
- CPM (Cost Per Thousand Impressions): The cost of 1,000 impressions. Calculate this by dividing your total cost by impressions and multiplying by 1,000.
- CPA (Cost Per Acquisition): The investment you’ve made to acquire one conversion (customer, purchase, sign up, contact, etc., based on the objective).
- CLV (Customer Lifetime Value): The estimated net profit a customer will bring to your business over their relationship with you.
2. Tracking with Coinzilla
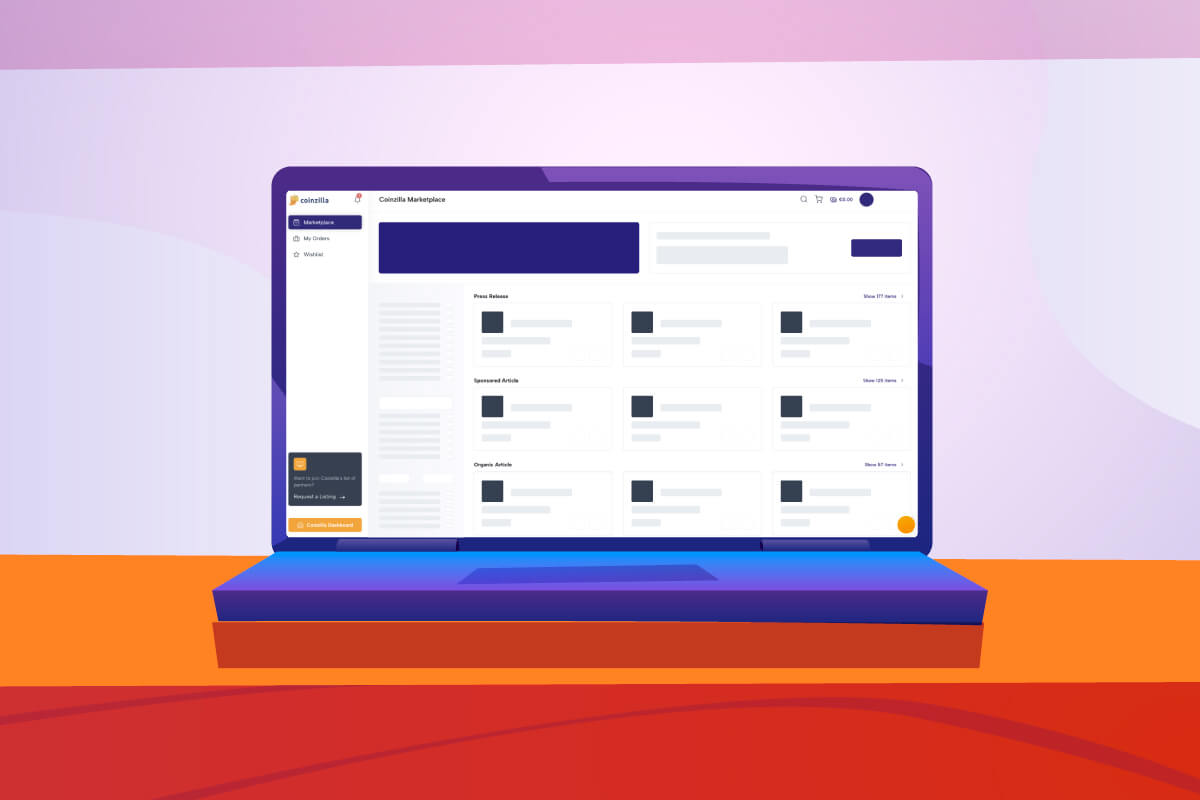
When advertising with Coinzilla, you can simply generate a report by going to the Reports tab from the left menu of the screen.
In the Reports section, you’ll be able to see different metrics of your campaigns and generate reports. Add the period you want to be presented in the report, select a campaign or all campaigns you’re interested in being presented in the report, and then select whether you prefer the reports by date, countries, operating systems, browsers, campaign, or zones.
Press the “Generate Report” button, and then, based on your reports, you can see how the advertising efforts went in that period for that specific campaign. Also, you can see metrics such as impressions, clicks, CTR, cost (or amount), and eCPM.
These metrics, paired with the attributes mentioned earlier, will help you determine how your campaigns perform on various devices, days of the week, or countries.
Data Discrepancies Between Coinzilla and Google Analytics 4
A common problem our customers encounter is the difference between the clicks reported in their Coinzilla account and the sessions reported in Google Analytics. This generally happens because the two metrics, clicks and sessions, differ.
If a user clicks on your ad more than once within 30 minutes, Google Analytics will report that as a single session. However, Coinzilla will track all the clicks.
The data discrepancy can also be caused by users who click on a banner by mistake.
If a user clicks on an ad but quickly closes the landing page before it can load correctly, Coinzilla will count that as a click. However, since Google Analytics didn’t have enough time to load its tracking script, it will not report that user.
3. Tracking with GA4
Google Analytics 4 is an essential tool for tracking your campaigns. With proper tracking in place, you’ll see:
- How much traffic your campaigns are driving;
- Which traffic sources convert;
- The revenue generated by each campaign;
Thus, you can act on a lot more data.
Our go-to method for setting this up is through Google Tag Manager (GTM). It gives you way more flexibility when tracking clicks, scrolls, form submissions, you name it. That said, you’ve got other options:
- Manual install by pasting the tracking code directly into your website;
- CMS/plugin install if you’re using WordPress or another builder.
Once the tracking code is live, test it using Google Tag Assistant. It’ll confirm everything’s firing as it should.
Now that your setup is in place, let’s examine how Google Analytics tracks user behavior.
How Event Tracking Works in GA4
Back in the day, with Universal Analytics, you had clear-cut goal types: Destination, Duration, Pages/Screens per session, and Events.
But with GA4, the game has changed. Goals don’t exist in the same format anymore. Instead, everything is tracked as events, and these events fall into four main categories:
- Automatically collected events;
- Enhanced Measurement events;
- Recommended events;
- Custom events.
You’ll need to know which type of event your event belongs to to track what matters. Then, structure and name your events accordingly. Here’s a breakdown to help you make sense of it all.
1. Automatically Collected Events
These events start tracking the moment you install GA4. No extra setup is needed.
Some examples:
- First_visit triggers when a user lands on your site for the first time;
- Session_start is when a new session begins;
- User_engagement is triggered after a user stays on a page for 10+ seconds.
You can find the complete list in Google’s documentation, but these three are the most relevant for most websites.
2. Enhanced Measurement Events
These are optional but super useful, especially if you want extra data without touching code or GTM. You can enable or disable them from Admin > Data Streams > Enhanced Measurement.
Events include:
- Page_view gets triggered on every page load;
- Scroll is fired when a user scrolls 90% of the page;
- Click are for outbound link clicks;
- View_search_results tracks site searches;
- File_download is triggered when users click download links;
- Form_start and form_submit tracks form activity (but can be hit or miss).
Remember that each event can be individually toggled on or off.
3. Recommended Events
Google has predefined these for specific industries. The event names and parameters are standardized, so use them if they fit your use case.
Examples:
- Add_to_cart;
- Purchase;
- Sign_up;
- Generate_lead.
Always stick to Google’s naming conventions here. Using their structure ensures your reports stay clean and functional.
4. Custom Events
These are events you define yourself when none of the built-in or recommended options apply. You must set them up manually through Google Tag Manager or your site’s code.
Some examples:
- Tracking a specific button click that doesn’t leave the page;
- Logging interactions with dynamic content or modals;
- Custom file types or downloads not covered by Enhanced Measurement.
Once your custom events are firing, you can mark the important ones as key events (what GA4 calls conversions).
In addition to setting up goals, you can also use UTM parameters to track and improve your reports. Simply put, UTMs are parameters that you include in your URL. These parameters tell Google Analytics where your traffic comes from in great detail.
The parameters available for UTMs are:
- Source — utm_source. Used to identify where your traffic is coming from. Example: utm_source=coinzilla
- Medium — utm_medium=yourmedium. Used to identify the medium through which your traffic was sent. Example: utm_medium=cpc
- Campaign — utm_campaign=yourcampaign. Used to identify a special campaign or promotion. Example: utm_campaign=wintercampaign
- Content — utm_content. Mainly used for content ads or A/B testing campaigns. Example: utm_content=logo or utm_content=text
- Term — utm_term=term. Used for paid search to identify the keyword. Example: utm_term=ad+network
In this example, your full UTM-tagged link would be:
But you don’t have to manually create your URL. Google’s Campaign URL Builder helps you generate your UTM-tagged link in just a few seconds.
Create a Campaign Tracking Dashboard in GA4
Creating a separate dashboard in Analytics is the best way to keep your tracking neat and tidy. This will also allow you to quickly check your campaign to see its performance and spot any anomalies before they cause a headache.
Despite their vast power, custom dashboards are one of the least-used functions of Google Analytics. At a glance, they seem super complex and even a little scary. But it’ll become much simpler once you take a few minutes to review it.
In Google Analytics Universal, you could whip up a dashboard under “Customization.” But in GA4, things work differently. You now have two main ways to build your own reporting space:
1. Use the “Library” to Customize Reports
Head over to Reports > Library (you need Editor or Admin access for this). Here, you can:
- Modify existing collections (like “Life cycle” or “User”);
- Create new custom reports using any dimensions and metrics you need;
- Decide which reports show up in your main navigation;
You can build reports that show campaign-specific traffic, conversion events, and revenue sources, all neatly grouped in one place.
2. Use Explorations for Deep-Dive Dashboards
The Explorations tab is your best friend if you want something more interactive and elaborate. Here, you can dig into granular insights and create dashboard-like reports tailored to your campaign goals.
Start by heading to the Explore section in GA4 and choosing the Free Form option. Before you build the layout, you need to load the correct data. Under the Variables column on the left, set your date range first. Then add the key dimensions you’ll want to analyze: Campaign, Session source/medium, and maybe Landing page + query string if you tie campaign performance to page performance.
Depending on your campaign goals, you’ll usually want Sessions, Conversions, Engagement rate, and possibly Event count or a specific event like purchase for metrics.
Once you’ve added those, move to the Tab Settings area where you actually build the table. Under Rows, add Campaign so each row represents a different campaign. If you want a deeper breakdown, throw in Session source/medium to see where traffic comes from. Add your metrics under Values, and if needed, toss in the Device category or Country under Columns to see how performance varies by device or region.
You can also apply filters to limit the report to a single campaign type—say, traffic where Session medium contains “email” or Campaign exactly matches “presale_phase_2025”.
Once the table loads, you can sort by any column, filter further by right-clicking on a data point, or create audience segments directly from the report.
In the end, you’ll have a live dashboard showing campaign performance by traffic source, user behavior, and conversions, all without jumping between reports or exporting into Excel.
And if this all sounds a bit much, there is no shame in using a template. There are tons of GA4 Exploration templates out there to get you started.